The Kinematic Sequence: What All Great Ball Strikers have in Common
- Jared

- Jan 29, 2021
- 5 min read
Updated: Oct 18, 2024
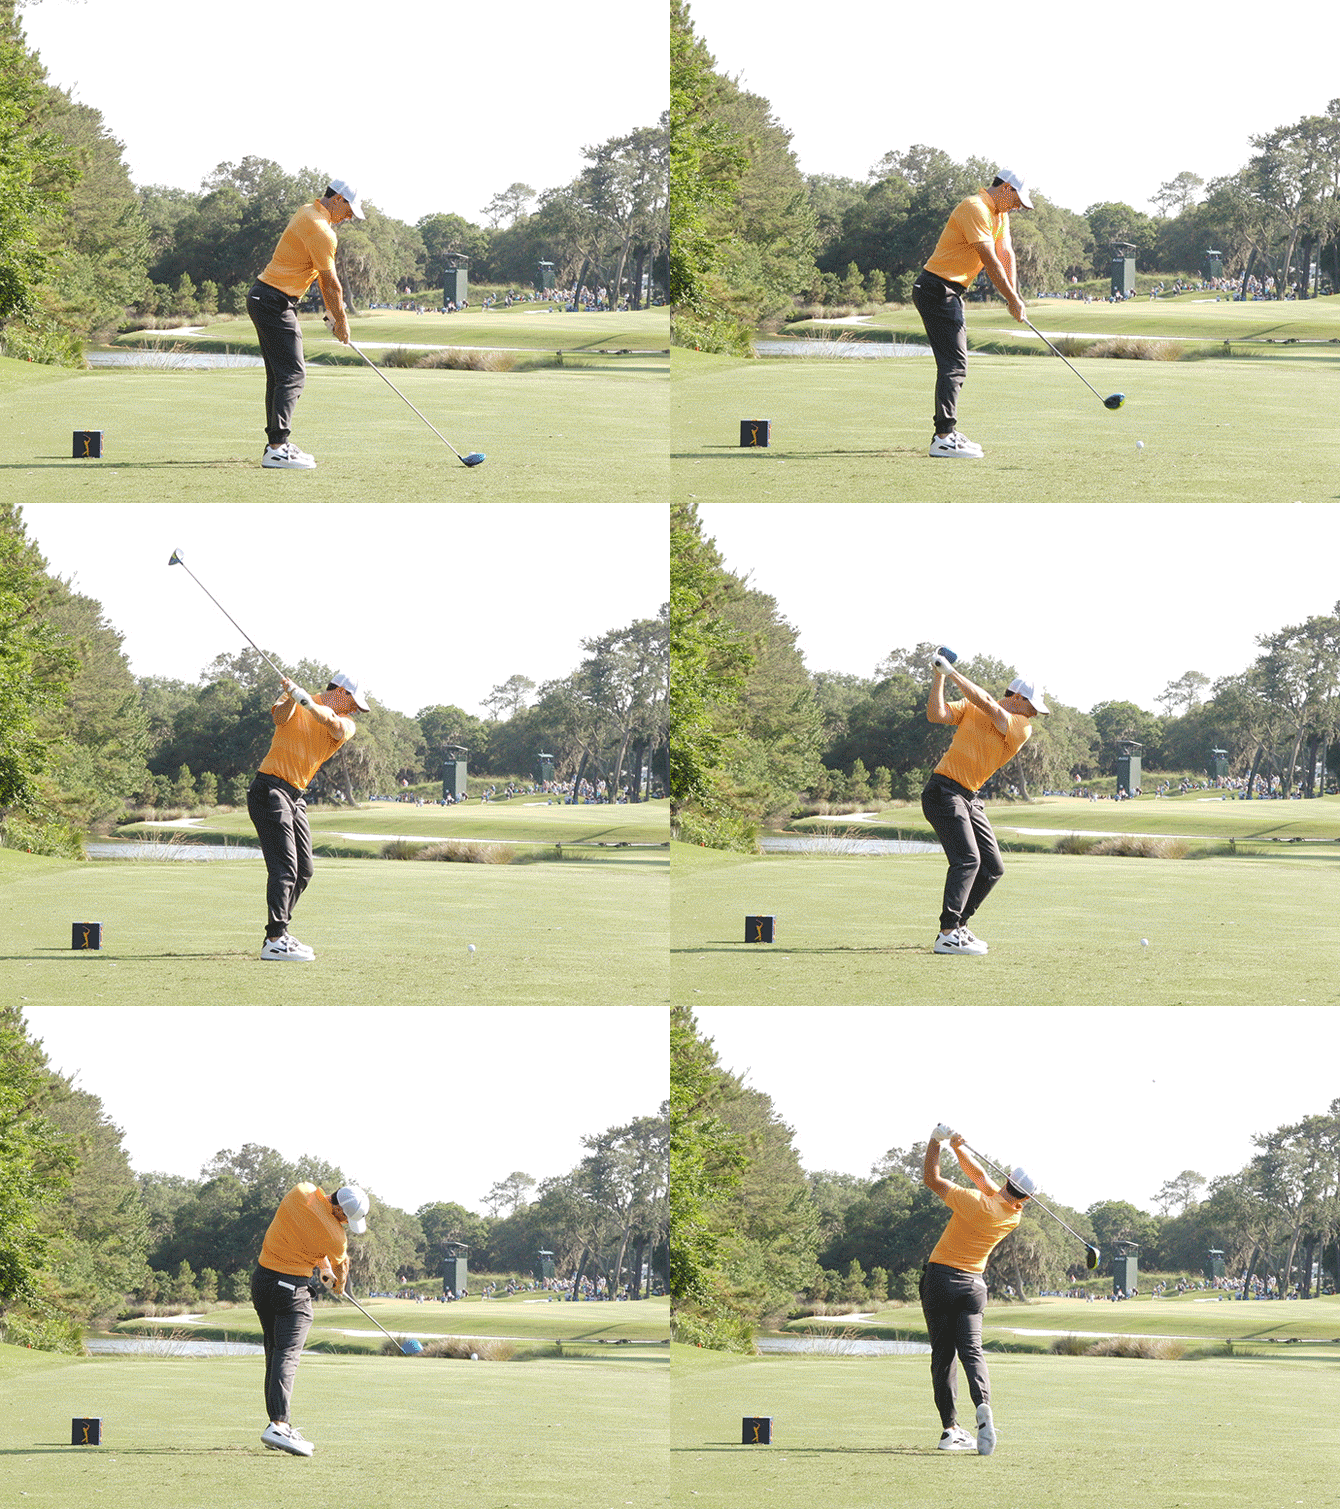
If you watch a PGA tour event you will quickly notice a wide variety of swing styles that look drastically different on video ranging from Adam Scott and Rory McIlroy to Jim Furyk, Bubba Watson and Matthew Wolff. Have you ever wondered how such drastically different looking swings can all be productive/efficient? Regardless of their swing style (how it looks), the best ball strikers all have something in common: the kinematic sequence, or transfer of energy that occurs during the swing. All great ball strikers begin by generating speed from their lower body and transferring this speed through their torso, into their arms, and then into the club.
Unfortunately this cannot be seen with traditional video analysis. This requires 3-D motion capture to assess this. However, thanks to tools such as K motion, amateurs can now get access to the same information as touring professionals. Keep reading to see how the kinematic sequence graph can help give you the valuable information that you are seeking to help improve speed, distance and consistency on the course.
What is the kinematic sequence graph?

Let's first start off by showing you what a kinematic sequence graph looks like and orient you to the what is going on in these graphs.
In the kinematic sequence graph below you will see four lines. The red line is is the pelvis. The green line is the torso. The blue line is the arms and the gold line is the wrists/club. Each of these lines is measuring the rotational velocity of that segment of the body. When the line goes up it accelerating. When it goes down it is decelerating.

The kinematic sequence graph can be broken down even further into two sequences: the transition/firing sequence and the downswing deceleration sequence. Both have important implications for the swing
The Transition Sequence: How do you initiate the swing?

Lets first break down the transition sequence. The transition sequence starts at the top of the backswing. The transition sequence starts as the player initiates their swing at first move. Think of this like the start of a race. An efficient transition sequence should begin with the lower body leading (red line), followed by the torso (green line), then the lead arm (blue line) and finally the club (gold line). The graph on the left is showing this efficient transfer of energy. Compare to the graph on the right where the club/gold line is firing too early and is out of sequence. This can limit energy transfer/speed as well as result in compensations the body will need to make during the downswing.
The Downswing Deceleration Sequence: Who won the race?
While it is important to see how you initiate the swing, the deceleration sequence provides even more insight into your swing. The deceleration sequence occurs after the transition sequence and finishes at impact.
During the swing the segments of your body should reach peak and then slow down as the next segment begins to accelerate. This mirrors the transition sequence in that the lower body should reach peak speed and decelerate first (red line on the graph), thorax second (green line), lead arm third (blue line) and the bat last (gold line). Using the analogy of a race this would mean that the red line (pelvis) won the race and is slowing down after it crosses the finish line. The green line (torso) should finish next, followed by the blue line (arms) and finally the gold (hands/golf club).
Compare the graphs below:
1. The graph on the left shows an efficient energy transfer
2. The graph in the middle shows a sequence that is out order or inefficient with the arms peaking too early.
3. The graph on the right shows the torso peaking too early. If you are out of sequence this doesn't mean you can't still play golf at a high level. However, you are going to have to make compensations during the swing which will make it more difficult to repeat the swing and be consistent.
As I mentioned above the downswing deceleration sequence can also provide us valuable insight into energy transfer and deceleration, which are critical for maximizing power.
Energy Transfer: Is There A Wave Of Energy?
Energy transfer is best visualized as a "wave" during this sequence. We should see the wave grow/build as it travels through each segment. On the graph this means the green line peaks higher than the red line. The blue line peaks higher than the green line and the gold line peaks higher than the blue line. The greater the difference between the peaks, the more energy that is transferred between segments. This indicates speed is increasing up the chain until it reaches the ball at impact.
Look at the two graphs below. The graph on the left indicates this increasing wave of energy throughout the sequence where each line is larger than the previous segment. On the right you can see how the green line (torso) and arm (blue line) are at the same height, which indicates minimal speed gain between these two segments.
Deceleration
The other important aspect to the deceleration sequence is the rate of deceleration. This is seen on the graph by how sharply the line increases (accelerates) and decreases (decelerates). The quicker a segment can decelerate, the faster the next segment can accelerate. This quick deceleration and acceleration can result in significant speed production. The graph on the left shows this quick deceleration in each of the lines (looks a mountain peak). In comparison the graph on the right has a much more gradual slope (like a gradual hill or mound). This indicates slow acceleration and deceleration and likely minimal power production. Notice that the player is in proper sequence, yet this doesn't guarantee maximal speed production.
What causes issues with proper sequencing and energy transfer?
The kinematic sequence graphs we showed above help to identify if a problem exists in sequencing and energy transfer. However, we then have to be able to answer why this problem exists. There are a couple of very common reasons for this:
1. Mechanics: common swing characteristics such as sway, slide, reverse spine angle, loss of posture, casting, scooping and early extension can create problems with the kinematic sequence.
2. Physical Limitations: limitations in mobility, stability, strength and power cause a breakdown in the kinematic sequence
3. Equipment such as the improperly fit clubs and even your footwear can alter your sequence.
When we combine all of this data we can start to make these connections and create a very targeted and specific approaching to your training program to make sure you are working on the right things to speed up the learning process and improve your performance on the course
*Disclaimer: There are many characteristics that make a great golfer besides the kinematic sequence and there are many tour professionals who do not have a perfect kinematic sequence. However, the great ball strikers will have the sequencing mentioned above.
Contact us today if you have interest in going through a 3-D swing analysis for your swing and see how you compare to the best ball strikers in the world. If you have any other questions in regards to 3-D motion capture you can email me at jared@jaredbicklept.com and I would be happy to answer any questions you have.








Comments